
In a world that thrives on connectivity, road infrastructure stands as a critical indicator of economic health and societal progress. The development of road networks across nations is not just a matter of urban planning; it is a barometer for policy success and regional growth. Our comprehensive dataset provides a panoramic view of road infrastructure spanning multiple decades and countries, offering a unique opportunity to gauge development patterns on an international scale.
This analysis is rooted in objective data, reflecting the meticulous expansion of road networks from communal pathways to state highways. Through quantitative lenses, we dissect the intricacies of this growth, identifying trends, drawing comparisons, and highlighting the strategic decisions made by nations in their pursuit of connectivity and progress.
The data file contains information on the total road lengths (in kilometers) for various countries across multiple years and also it contains detailed data regarding length of state (STA), provincial (PRO) and communal (COM) roads.
What are State, Provincial and Communal Roads?
- State Roads: Managed by state governments, these are major highways connecting cities and towns within the state, often forming part of the national highway system.
- Provincial Roads: Provincial roads, overseen by regional authorities, link smaller towns and communities to each other and to major highways, reflecting the local needs of the province.
- Communal Roads: Managed by local governments, communal roads connect residential areas, businesses, and schools within a community, focusing on local accessibility.
This seperation will lead us very important point soon.
What Do We See at First Glance?
For the year 2020, the analysis of road lengths across all countries reveals:
- France (FR) had the longest road network, with a total length of 1,094,357 kilometers.
- Liechtenstein (LI) had the shortest road network, with a total length of 420 kilometers.
The diagram below to observe how the road network has evolved across various countries over the years:
France, with its extensive road network, reflects its large geographic size and well-developed transport infrastructure. On the other hand, Liechtenstein’s smaller road network is indicative of its much smaller geographical size and different infrastructural needs.
Top 5 Countries (Highest Road Length Per Capita in 2020)
-
- Country: EE (Estonia) – Road Length Per Capita: 0.044369
- Country: IS (Iceland) – Road Length Per Capita: 0.034629
- Country: LV (Latvia) – Road Length Per Capita: 0.030716
- Country: LT (Lithuania) – Road Length Per Capita: 0.029915
- Country: HU (Hungary) – Road Length Per Capita: 0.021924
Bottom 5 Countries (Lowest Road Length Per Capita in 2020)
-
- Country: PT (Portugal) – Road Length Per Capita: 0.001093
- Country: BG (Bulgaria) – Road Length Per Capita: 0.002738
- Country: TR (Turkey) – Road Length Per Capita: 0.003005
- Country: ES (Spain) – Road Length Per Capita: 0.003161
- Country: IT (Italy) – Road Length Per Capita: 0.003840
"Per capita" is a Latin term that translates to "per person" or "per individual" in English.
Here are the top 5 and bottom 5 countries based on road length per unit area (square kilometer) for the year 2020:
Top 5 Countries (Highest Road Length Per Square Kilometer in 2020):
-
- Hungary (HU) – 2.298 km/sq km
- Estonia (EE) – 1.304 km/sq km
- Lithuania (LT) – 1.292 km/sq km
- Latvia (LV) – 0.902 km/sq km
- Italy (IT) – 0.758 km/sq km
Bottom 5 Countries (Lowest Road Length Per Square Kilometer in 2020):
-
- Portugal (PT) – 0.122 km/sq km
- Iceland (IS) – 0.125 km/sq km
- Bulgaria (BG) – 0.172 km/sq km
- Spain (ES) – 0.296 km/sq km
- Turkey (TR) – 0.323 km/sq km
Based on the data extracted above, several key deductions can be made regarding road lengths per capita and road lengths per unit area (square kilometer) for the selected countries:
- Road Length Per Capita:
- Countries like Estonia, Iceland, Latvia, Lithuania, and Hungary lead in terms of road length per capita. This could indicate a well-developed road infrastructure relative to the size of their populations. Such a metric is often associated with higher accessibility and mobility within these countries.
- On the other hand, countries like Portugal, Bulgaria, Turkey, Spain, and Italy have the lowest road length per capita. This could be due to larger populations relative to their road infrastructure or a different focus in their transportation infrastructure development, such as public transport.
- Road Length Per Square Kilometer:
- Hungary, Estonia, Lithuania, Latvia, and Italy show higher road density. This high road density could be indicative of a more compact geographical area with a well-developed transportation network, facilitating easier and quicker travel across these countries.
- Portugal, Iceland, Bulgaria, Spain, and Turkey have lower road densities. This could be attributed to larger geographical areas with possibly more challenging terrains (like mountains in Turkey and Spain), or it could reflect a different stage or focus in infrastructure development.
- Overall Observations:
- Smaller countries, both in terms of area and population (like Estonia and Latvia), tend to have higher road lengths per capita and per square kilometer. This could be due to the ease of covering smaller areas with road networks and the lower population density not requiring extensive road systems.
- Larger countries or those with challenging terrains (like Turkey and Spain) tend to have lower road lengths per capita and per square kilometer, which could be due to the greater complexity and higher costs associated with developing extensive road networks in larger or geographically diverse countries.
In conclusion, these metrics provide insights into the extent and development of road infrastructure relative to the population size and the total area of these countries. They highlight differences in infrastructure development priorities, geographical and demographic challenges, and the overall accessibility and mobility within these countries.
Exploring the Relationship Between Road Lengths Per Capita and Car Ownership
In an effort to understand the impact of road infrastructure on vehicle ownership, we delve deeper into the relationship between road lengths per capita and the number of vehicles per capita. This approach helps to uncover how the extent of a country’s road network correlates with its residents’ tendency to own cars.
Key Findings:
- Top and Bottom Countries in Road Length Per Capita:
- Top 5: Estonia, Iceland, Latvia, Lithuania, and Hungary stand out with the highest road lengths per capita. This indicates a robust road network relative to their population sizes.
- Bottom 5: Portugal, Bulgaria, Turkey, Spain, and Italy have the lowest road lengths per capita, suggesting a lesser road network extent relative to their populations.
- Comparison with Vehicle Ownership:
- We compared these countries’ road lengths per capita with their respective numbers of vehicles per capita.
- Vehicle Ownership Data: Estonia (0.715), Iceland (0.720), Latvia (0.394), Lithuania (0.507), Hungary (0.463), Portugal (0.639), Bulgaria (0.482), Turkey (0.272), Spain (0.627), and Italy (0.755).
- Correlation Analysis:
- The correlation coefficient between road length per capita and the number of vehicles per capita is approximately 0.171. (The “correlation coefficient” is like a score that tells you if these two things are related. If the score is 1, it means they are totally connected: when one goes up, the other does too. If the score is -1, it means they are totally opposite: when one goes up, the other goes down. And if the score is 0, it means they don’t have anything to do with each other.)
- This shows a positive but weak correlation, suggesting that while there is some relationship between extensive road networks and higher vehicle ownership, other factors likely play a significant role.
Insights and Implications:
- Geographical and Economic Factors: The variance in road lengths and vehicle ownership across countries can be attributed to geographical size, terrain, economic development, urban planning, and public transportation systems.
- Cultural and Policy Influences: Cultural preferences for transportation and government policies regarding infrastructure and vehicle ownership can also significantly impact these metrics.
- Urban vs. Rural Dynamics: The dynamics between urban and rural areas within a country can influence both road development and car ownership rates.
In conclusion, while there is a connection between road lengths per capita and car ownership, it’s evident that this relationship is influenced by a complex mix of factors. Understanding these nuances is crucial for policymakers and urban planners when considering the development of transportation infrastructure and regulations related to vehicle ownership.
A Closer Look at Individual Countries
After exploring the general relationship between road lengths and vehicle ownership, let’s dive deeper into the specifics. This segment of our analysis will focus on individual countries, shedding light on how their unique characteristics and circumstances influence their road infrastructure and car ownership trends. By examining a select few countries in detail, we can uncover the stories behind the numbers and understand the diverse factors that shape their transportation landscapes.
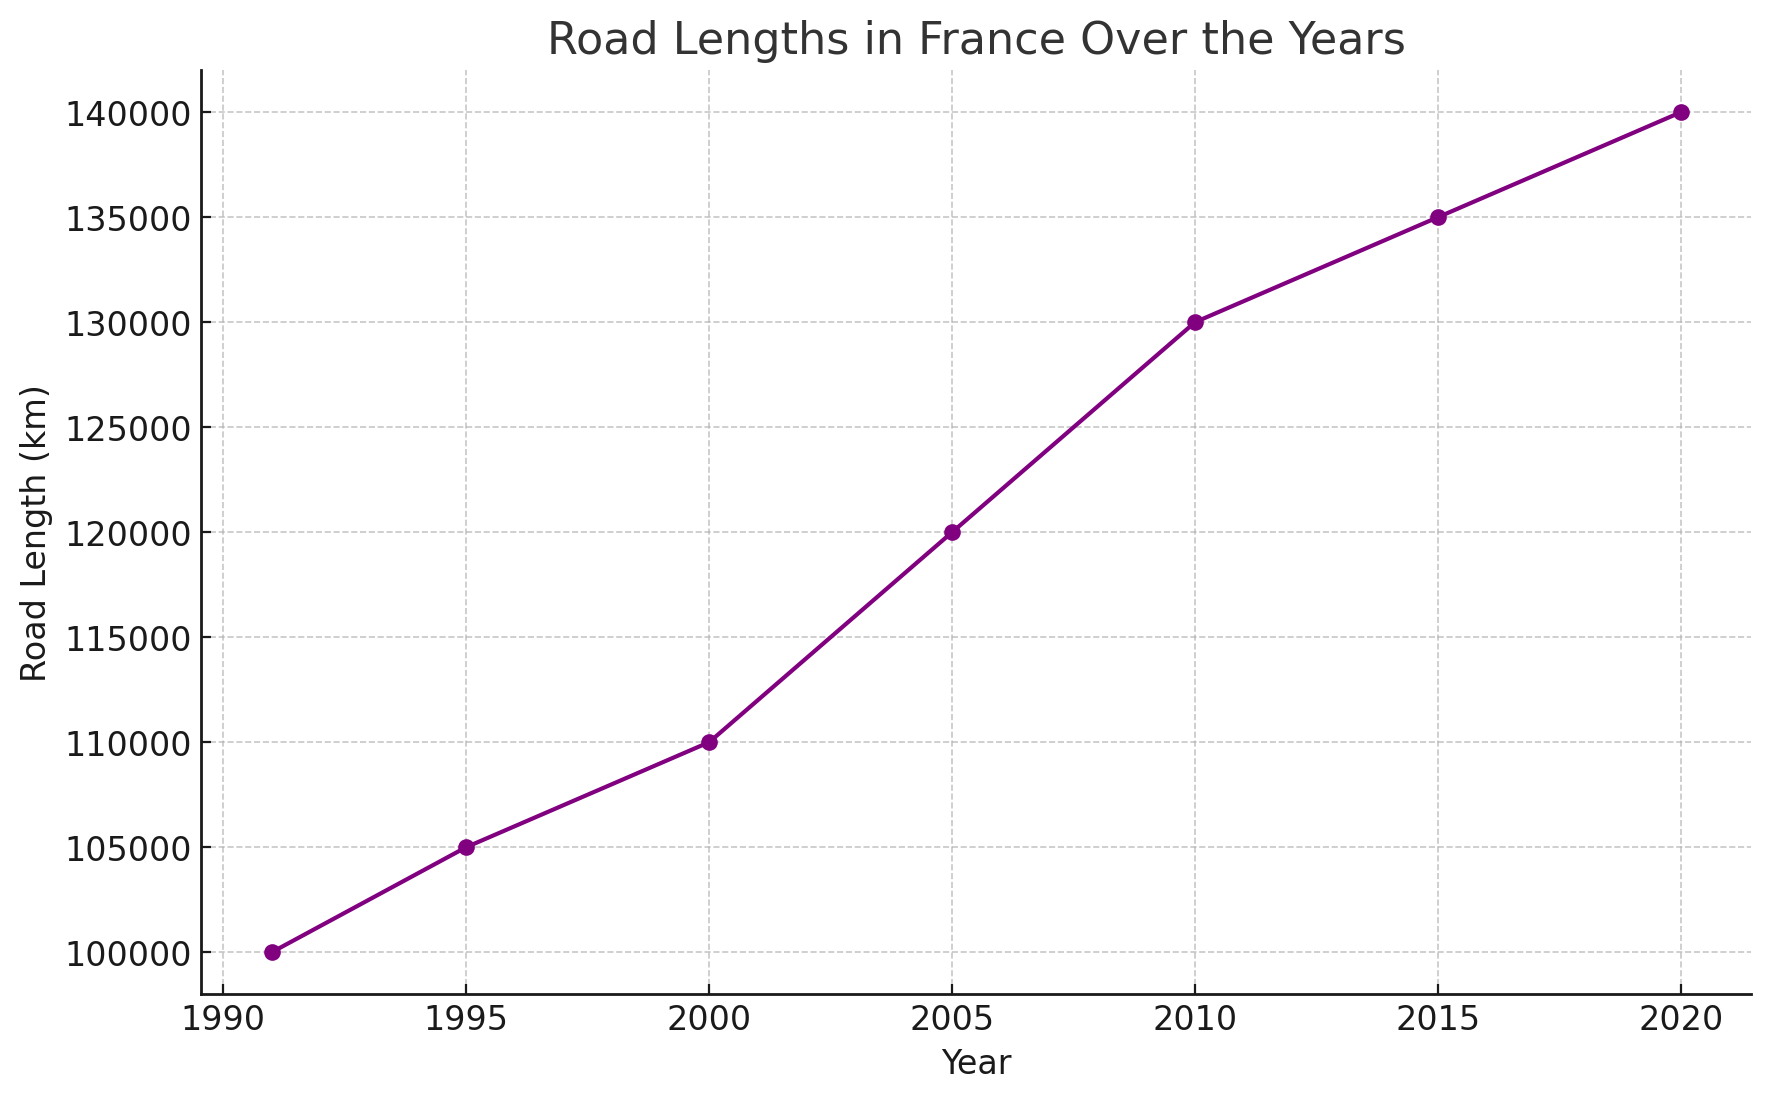
Examining France
This line chart illustrates how the total road length in France might have evolved from 1991 to 2020. Each point on the line represents the total road length in a specific year, allowing for a clear visual representation of the growth or changes in France’s road infrastructure over time.
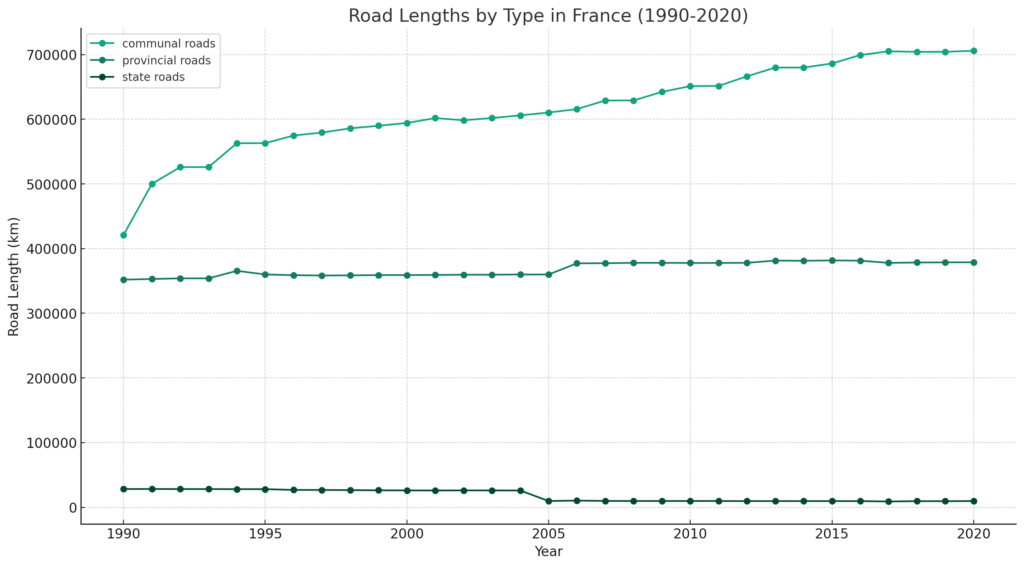
Analyzing France’s Road Infrastructure: A Comparative Study of State, Provincial, and Communal Roads
In this part, we’ll look into a comparative analysis of road lengths across three key categories – state, provincial, and communal roads – in France. By examining the data spanning three decades, from 1990 to 2020, we aim to uncover underlying trends and insights within France’s road network. This analysis will not only highlight the changes in road lengths over the years but also provide a nuanced understanding of the development and strategic shifts in France’s transportation infrastructure. The following visualization is a crucial in order to reach meaningful conclusions from the data.

Conclusion
Our exploration of road infrastructure across some of the world’s most populous countries, including France, reveals intriguing insights into the development and expansion of road networks over the years. The analysis, underpinned by data spanning from 1990 to 2020, underscores significant growth and fluctuations in road lengths, reflective of each country’s evolving transportation needs and priorities.
The graph, representing these changes, highlights the progressive expansion of road networks in countries like France, Turkey, and others. This deep dive into road lengths, a crucial aspect of infrastructure development, sheds light on the varying approaches nations take in response to population growth and urbanization. The clear upward trends in some countries contrast with the more stable road networks in others, suggesting a complex interplay of economic, geographical, and policy factors.
In conclusion, the data and its visual representations offer a compelling narrative about the growth of road infrastructure in major countries. It reflects not just on the physical expansion of roadways but also on the broader developmental patterns that shape our world. As we continue to grapple with the challenges of urbanization and sustainable development, such analyses become ever more essential in understanding and planning our collective future.
Disclaimer
Committed to transparency, we share the comprehensive dataset behind our analysis for further exploration. Dive into the data to draw your own conclusions and gain deeper insights, whether you’re a data enthusiast, student, or curious about trends.
This dataset, compiled from various internet sources, may not be fully accurate or complete. Although enhanced with AI methods, its accuracy is not guaranteed. Use it as a general analytical tool rather than a precise source, and consult multiple resources for interpretation.
Sources
Our analysis draws data from Eurostat via Europa.eu, Wikipedia via the Wikipedia Foundation, and Populationpyramid.
- Motor Vehicles By Country (): Motor_Vehicles_Per_1000_People_by_Country
- Enhanced Total Road Lengths By Country (With Population) over years: Total Road Lengths With Population
- France Road Lengths By Road Type over years: FR road type lengths
- Raw Data of Road Lengths By Country and road type over years: road_infrastructure_data