
Today we will look at some interesting data from the European statistical office. These data show us the number of people killed in traffic accidents involving different types of vehicles. Eventually we will have a better idea of which type of transportation is safer and maybe look at some interesting details. We can also compare how different countries fare on road safety.
Overview of Road Accident Fatalities – 1999 to 2021
We have data from 1999 to 2021 about people who died in road accidents. This information includes 27 countries in Europe. We’ll see how these accidents have changed over time and compare different countries.
It’s quite easy to say that there was a significant decrease in the number of fatal accidents. In 1999, you had twice the chance of dying in a road accident, including public transportation accidents.


In the 2000s, 50,000 people lost their lives on the roads while they were trying to go to work or on holiday, which is truly tragic. However, nowadays, the number of people lost their lives on the roads is around 20,000 in Europe. It appears that new regulations and safety measures are working effectively, but it’s evident that we still need more and more.
Road Accident Fatalities Across European Nations
In this section we look at a comparative analysis of road traffic deaths in seven European countries: Denmark, Germany, Spain, France, the Netherlands, Italy and Romania. The graph below is very similar to the first graph we examined, but some interesting points stand out here. Now let’s take a deeper look.
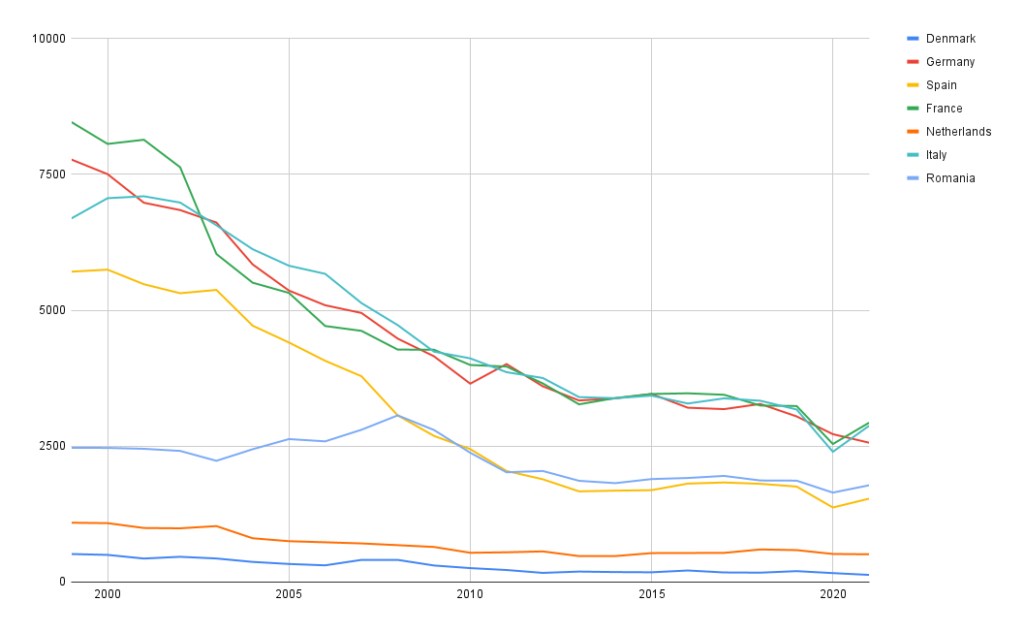
Different Trends in Each Country
We need to take into account the populations of the countries when making these analyses, but for now there are different things we want to observe in this graph. We see a similar graph in large countries such as Italy, Germany, Spain and France. In the beginning, there are a lot of deaths, and over time, this number gradually decreases.
However, in small countries such as the Netherlands, Denmark and Romania, we do not see a serious change in the number of deaths over the years. There may be many reasons for this, and a sudden increase may not have occurred, especially since their population and road infrastructure cannot be compared with other countries.
These changes seem to be due to new rules, better roads, safer cars and people being more knowledgeable about road safety. This information clearly shows how road safety is getting better in different European countries. Making roads safer and seriously educating people about traffic is the easiest way to reduce deaths. Additionally, I don’t see any problem in relying on developing technology.
Road Accident Fatalities Vehicle Type Dependent
In this section, we will take a brief look at the number of deaths by different vehicle types. The number of people who lost their lives by driving cars, buses, trams, bicycles and riding animals from 2013 to 2020 can tell us some things.
As you can easily see in the graph below, the rate of losing your life in your personal vehicle is extremely high compared to other vehicle types.

Key Findings
- We see a decreasing trend over the years in the number of deaths resulting from car accidents. There is also a decrease of up to 20% in 2020 and 2021. This decline was probably due to reduced travel during the COVID-19 pandemic.
- The number of deaths resulting from bus accidents is quite low, especially when compared to personal car accidents. The highest number was recorded in 2021 with 101 deaths.
- We observe that the number of deaths in Trams and Light Rail Vehicles is constantly decreasing, indicating that this mode of transportation is relatively safe.
- There was an overall increase in bicycle fatalities, peaking in 2016 and 2019. However, there was a similar decline in vehicles in 2020 and 2021. This may be due to increased bicycle paths and safety measures.
- Interestingly, it turns out that riding on animals like horses, donkeys, or mules carries a higher risk of a fatal accident than traveling on Trams and Light Rail Vehicles.
These findings show the varying risk levels associated with different transportation methods, and the population infrastructure of the country you live in will of course affect these chances. But the overall decline we observe in each chart seems to be due to improved security measures and taking advantage of the advantages technology provides us.
Gender Variation in Road Accident Fatalities
The number of deaths is very different between genders. This is a clear indication that men still dominate the roads. For example, in 2021, there were 15,112 male deaths compared to 4,223 female deaths.

Key Findings
Decreasing Tendency in Both Gender: Both male and female deaths have shown a decreasing trend over the years. This is due to road safety and technology improving over the years. In addition to these developments, we can say that security campaigns and policies also contribute to this decreasing trend.
Notable Drop in 2020: There is a notable drop in fatalities for both genders in 2020. We made this observation in our previous graphs and deduced that the reason was the decrease in traffic due to COVID-19.
Relative Stability in Female Deaths: While there is an overall decrease in both sexes, the decrease in female deaths is more stable and less fluctuating than male deaths. Moreover, when we look at this situation by adding the increase in the number of women in traffic, we can say that women are less involved in positive accidents in traffic compared to men.
Age Variation in Road Accident Fatalities
According to the data that we are examining, we can notice another interesting point. People aged 25 to 49 and those aged 65 years or older lose their lives more frequently than other age groups in road accidents.
| AGE | 2012 | 2013 | 2014 | 2015 | 2016 | 2017 | 2018 | 2019 | 2020 | 2021 |
|---|---|---|---|---|---|---|---|---|---|---|
| Less than 15 years | 655 | 585 | 625 | 584 | 558 | 516 | 490 | 485 | 380 | 465 |
| 15 to 17 years | 689 | 563 | 575 | 542 | 533 | 494 | 495 | 474 | 410 | 433 |
| 18 to 24 years | 3.773 | 3.419 | 3.146 | 3.219 | 3.065 | 2.780 | 2.709 | 2.710 | 2.290 | 2.333 |
| 25 to 49 years | 9.410 | 8.534 | 8.304 | 8.445 | 8.105 | 8.105 | 7.841 | 7.597 | 6.293 | 6.495 |
| 50 to 64 years | 4.976 | 4.670 | 4.875 | 4.800 | 4.849 | 4.922 | 4.924 | 4.792 | 4.073 | 4.259 |
| 65 years or over | 6.176 | 6.023 | 6.185 | 6.350 | 6.607 | 6.470 | 6.684 | 6.412 | 5.132 | 5.272 |
Above table shows total number of deaths in road accidents for 27 counties which are; Belgium, Bulgaria, Czechia, Denmark, Germany, Estonia, Ireland, Greece, Spain, France, Croatia, Italy, Cyprus, Latvia, Lithuania, Luxembourg, Hungary, Malta, Netherlands, Austria, Poland, Portugal, Romania, Slovenia, Slovakia, Finland, Sweden, Iceland, Liechtenstein, Norway, Switzerland, United Kingdom.

Key Findings Regarding Age Groups Deads on Roads
Age Group Vulnerability: People between the ages of 25 and 49 have always had the highest death toll from 2012 to 2021. However, we observe the fastest downward trend in this group.
Similarly, we see the same high number of deaths in the 65 and over age group. We see the highest score in this group with 6,607 in 2016.
Decreasing Trend in All Age Groups: We see a decreasing trend in all age groups over the years. This is a good sign for all of us! This shows that road safety is improving, we have better vehicle safety standards and social awareness is increasing day by day.
Young Drivers and Teenagers: The 18-24 age group, which generally represents younger drivers, showed a significant decrease in the number of deaths, from 3,773 in 2012 to 2,333 in 2021.
We also observe a decrease in deaths in the younger age groups, those under 15 years of age and between 15-17 years of age.
Pandemic Effect: In 2020, there is a decrease in deaths in all groups, probably due to the impact of the COVID-19 epidemic and reduced traffic trips.
Elderly Road Users: Mortality rates in the 65 and over age group are high compared to other age groups; This highlights the need for focused safety measures for older road users. Another issue in this regard may be that other age-related diseases reduce the chance of surviving traffic accidents.
Disclaimer
Committed to transparency, we share the comprehensive dataset behind our analysis for further exploration. Dive into the data to draw your own conclusions and gain deeper insights, whether you’re a data enthusiast, student, or curious about trends.
This dataset, compiled from various internet sources, may not be fully accurate or complete. Although enhanced with AI methods, its accuracy is not guaranteed. Use it as a general analytical tool rather than a precise source, and consult multiple resources for interpretation.
https://ec.europa.eu/eurostat/databrowser/view/tran_sf_roadse/default/table?lang=en
